The main centre-right and centre-left parties have lost their 40-year old grip on the European Parliament. As the results of the 2019 European Elections flowed in, it quickly became clear that voters had opted for alternatives such as the greens, liberals and far right. Fears about a populist Eurosceptic tidal wave were unfounded but they will still take more seats in the European Parliament than ever before. Italy, the UK and France all saw populist victories with Marine Le Pen’s National Rally narrowly and symbolically beating Emmanuel Macron’s En Marche in the latter. One of the most notable aspects of the election was voter turnout which soared to a 20-year high.
At 11:00 CET, provisional voter turnout was 50.95 percent, the highest level seen since 1994 and a reversal on four decades of decline. Turnout had been dropping steadily since 1979, falling from 62 percent that year to 42.6 percent by 2014. Many analysists are attributing the high turnout this year to increasing support for populist parties, desire to show support for the European project and heightened awareness of climate change and environmental issues. That saw support climb steeply for the EU’s green parties who were particularly successful in Germany, France, and Ireland.
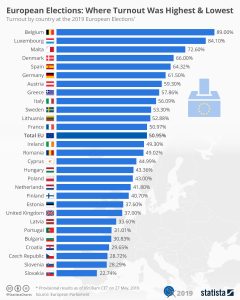
According to the European Parliament’s website, Belgium had the highest provisional voter turnout at 89 percent, ahead of Luxembourg’s 84 percent. In the United Kingdom, which is bitterly divided about Brexit, turnout was far less at 37 percent. Slovakia had the lowest turnout levels of any EU country at just 22.7 percent. Senior EU officials welcomed the news of a considerable increase in voter turnout, hailing it as a boost for the legitimacy of EU lawmaking.
source statista