
Over the past few weeks, we’ve seen a deluge of historically bad economic data as the fallout of the measures taken to contain the coronavirus becomes more and more apparent. On Friday, the U.S. Census Bureau released preliminary retail sales figures for April, showing yet another historic decline in economic activity.
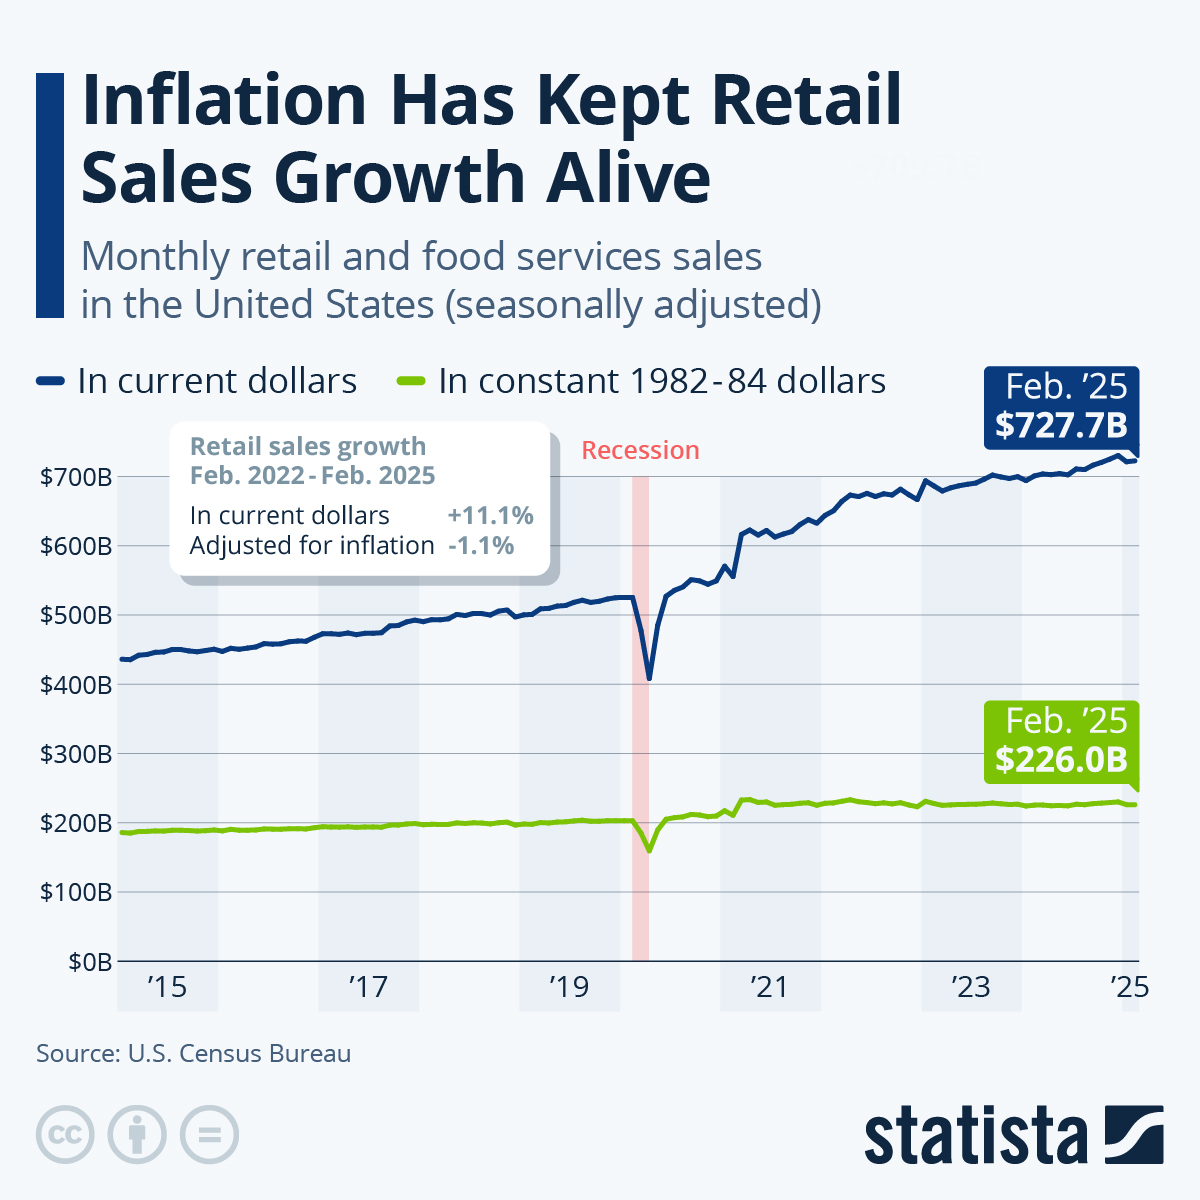
Retail and food services sales fell 16.4 percent in April, following an already unprecedented 8.3 percent drop in March. To put this in perspective, the highest drop prior to March 2020 had occurred in November 2008, when retail sales declined by less than 4 percent at the height of the financial crisis. As the following chart shows, retail sales have very rarely dipped significantly in the past, with the financial crisis being the most notable exception of the past three decades.
also read
COVID-19: Testing Capacity Compared (infographic)
Bundesliga Return Attracts Record Audience (infographic)
In total, retail and food services sales amounted $403.9 billion in April, the lowest level on record since August 2012 – and that’s not even accounting for inflation. While grocery stores and nonstore retailers (think e-commerce) were relatively unaffected by the historic drop, clothing stores were hit particularly hard, seeing sales drop by 79 percent compared to the previous month and by almost 90 percent compared to the same period a year ago.
source statista
You will find more infographics at Statista