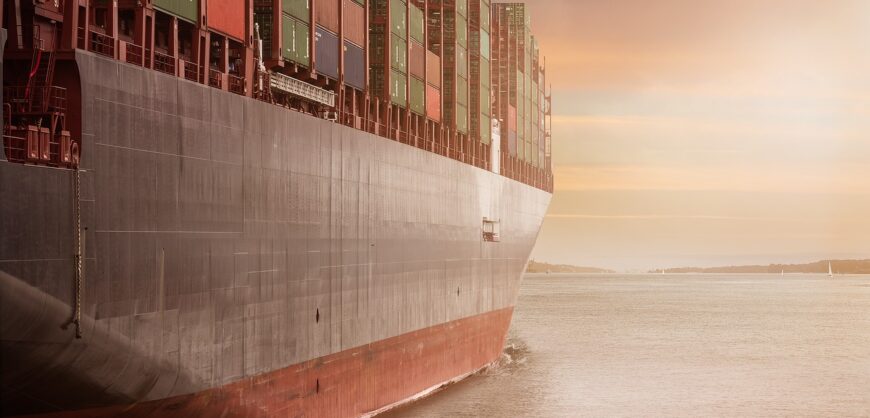
As salvage teams were finally able to dislodge the giant container ship wedged in the Suez Canal on Monday, the world is breathing a sigh of relief over an averted global supply crisis.
Ever since the 1,300-feet long Ever Given ran aground last Tuesday, one of the world’s most important trade arteries had been clogged, forcing more than a hundred ships laden with oil and other cargo to anchor in the canal and the adjacent Red and the Mediterranean Sea.
As billions of dollars worth of goods and supplies were stuck in what was essentially a giant seaborne traffic jam, the vulnerabilities of global supply chains were once again put on display. With every day, the financial damages caused by the delays were mounting. Meanwhile, container ports around the world, which are already strained by heightened demand due to the pandemic, are bracing for chaos now that the canal is passable again.
According to data published by the United Nations Conference on Trade and Development (UNCTAD), globalization has caused a steep increase in maritime trade over the past few decades, with the total volume growing from 4,000 million tons loaded in 1990 to more than 11,000 million tons loaded in 2019. Container shipping, in particular, has boomed over the past three decades, with total shipping volume growing nearly eightfold since 1990.
source statista
You will find more infographics at Statista


