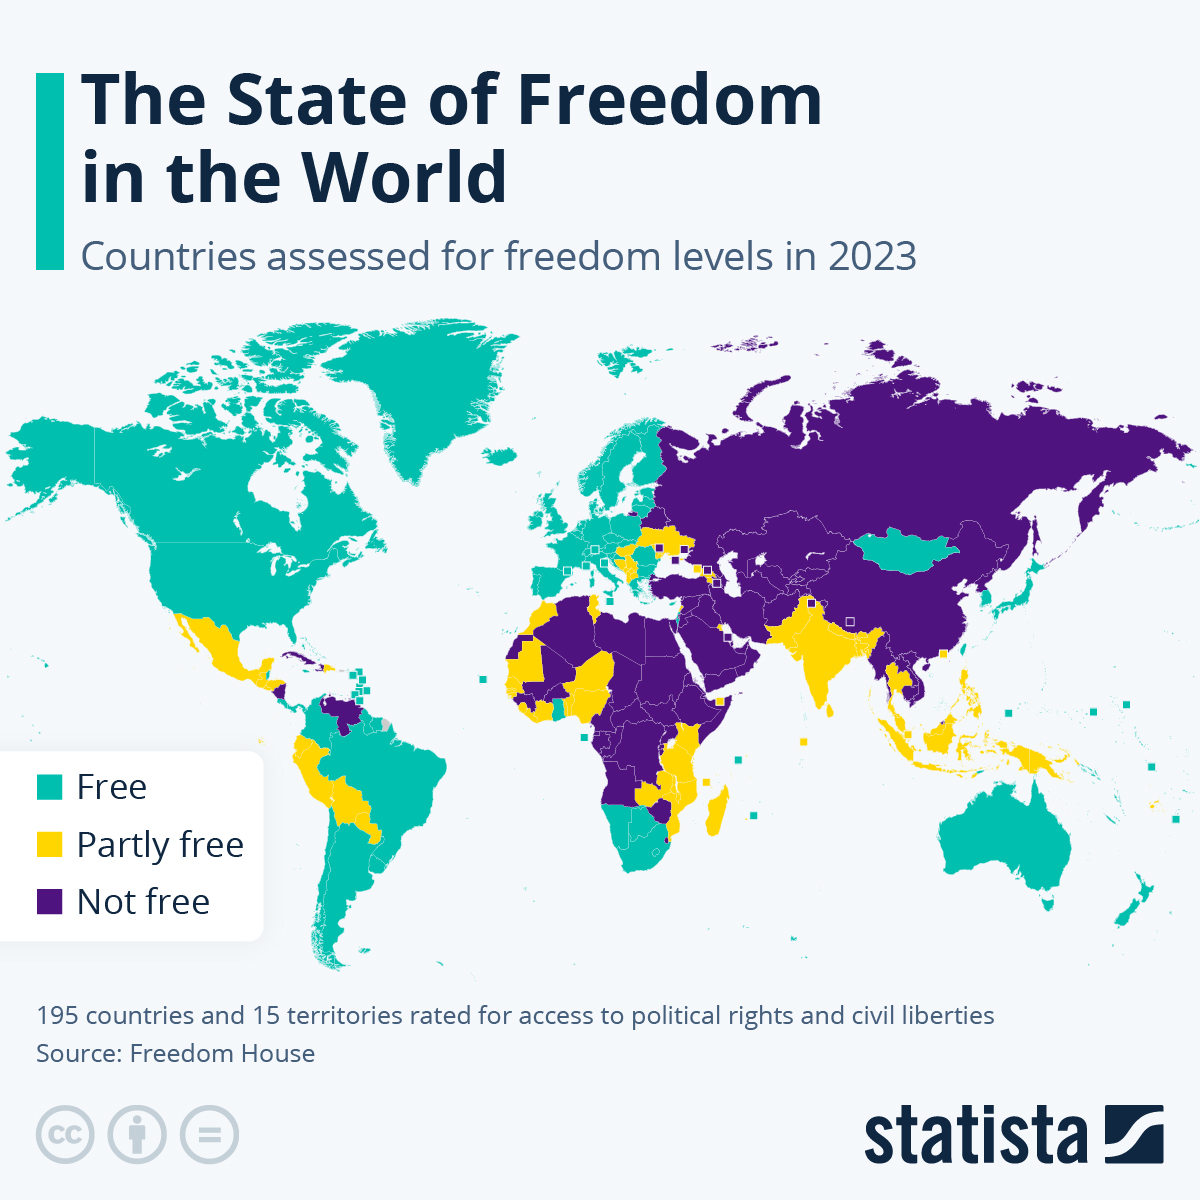
Democratic watchdog organization Freedom House has released its annual ranking of the world’s most free and most suppressed nations. The report is considered a key barometer for global democracy and this year’s edition found that while global freedom has declined for the 17th year straight, the world may be headed towards a “possible turning point”, as the rate of decline is leveling off. This partly comes down to the easing off of pandemic-related restrictions which had impacted freedom of assembly and freedom of movement.
Conflicts, such as Russia’s war in Ukraine, as well as coups and attempted coups, as seen in Peru, are just some of the reasons freedom levels have declined, according to Freedom House. Countries where political divisions run deep were also mentioned, including in Brazil, where Bolsonaro’s supporters stormed Congress, the Supreme Court and the presidential palace in December after Lula won the election. In Afghanistan, the watchdog cites how the ruling Taliban have stopped girls from attending education after they reach their sixth grade and from attending universities, while in the West Bank, the Israeli government’s continued demolition of Palestinians’ housing is also highlighted as a clear cause of freedoms being curtailed.
A total of 195 countries and 15 territories were analyzed on their levels of access to political rights and civil liberties, before being categorized as either “free”, “partly free” or “not free”. Of those, 35 countries saw their scores fall, while 34 countries saw improvements. The analysis shows that press freedom is in retreat, as the number of countries receiving 0 points out of 4 for the indicator of ‘media freedom’ has shot up from 14 to 33 in the past 17 years.
While democracy has indeed been in decline for nearly two decades, the global landscape has improved since the report was first published 50 years ago. Back then, 44 out of 148 countries were counted as “free”, versus 84 out of 195 today.
NOTE – Freedom House is partly funded by the US Government
You will find more infographics at Statista
Ask me anything
Explore related questions


