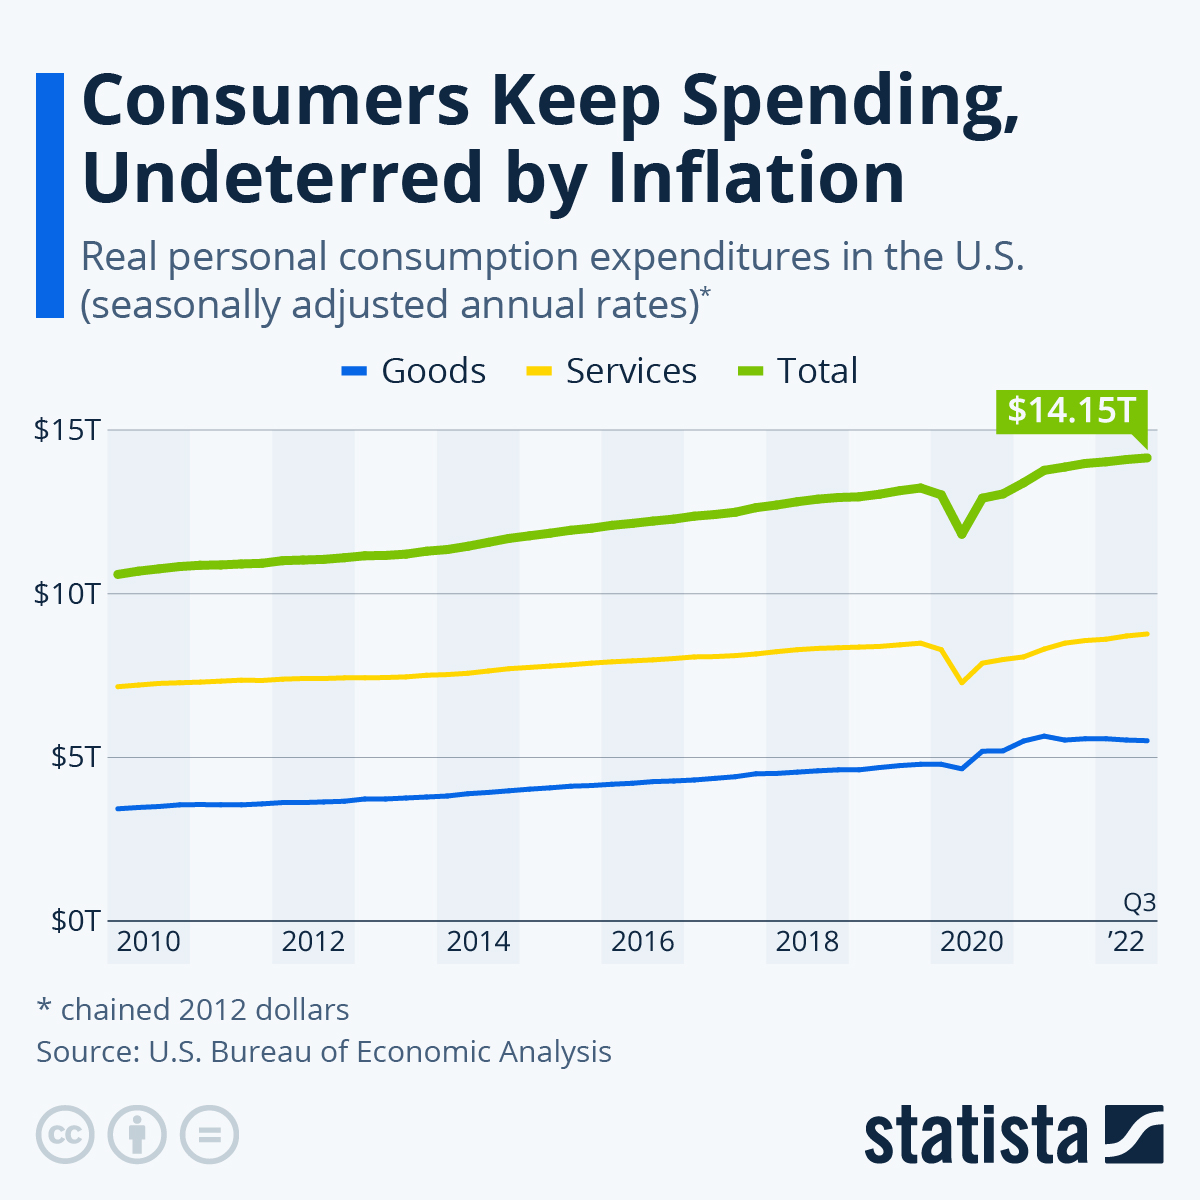
When the COVID-19 pandemic arrived in the United States in March, forcing widespread lockdowns to contain the spread of the virus, consumer spending fell off a cliff. Following an abysmal April, which saw spending levels down more than 18 percent compared to January, personal consumption expenditure started to recover, however, coming within 1.75 percent of pre-pandemic levels in October before edging down slightly in November and December.
That’s only half the story though, as the following chart, based on data from U.S. Bureau of Economic Analysis, illustrates. While spending on goods quickly recovered from the initial shock, returning to growth as early as June, consumer spending on services is still more than 5 percent off pre-pandemic levels.
The reasoning behind these numbers is straightforward: as the pandemic severely limited people’s option to spend money on services, e.g. restaurant visits, travel and other leisure activities either restricted or advised against, they shifted their spending to physical goods, trying to adjust to life with the coronavirus.
And while it’s certainly positive to see overall spending levels recover relatively quickly, especially considering that 10 million Americans are still jobless, the sluggish recovery of consumer spending on services is cause for concern. After all, the United States is a service economy, as a look at the composition of the U.S. GDP reveals: in 2019, personal consumption expenditure on services accounted for 47 percent of the gross domestic product, making it by far the biggest contributor to the country’s economic output.
source statista
You will find more infographics at Statista
Ask me anything
Explore related questions


