Despite impassioned pledges to stop supplying funds to Putin’s war on Ukraine, many countries have found ending their dependence on Russian fossil fuels rather difficult. In Europe, where this desire was probably strongest, long-standing supply chains with Russia have also proven some of the hardest to break.
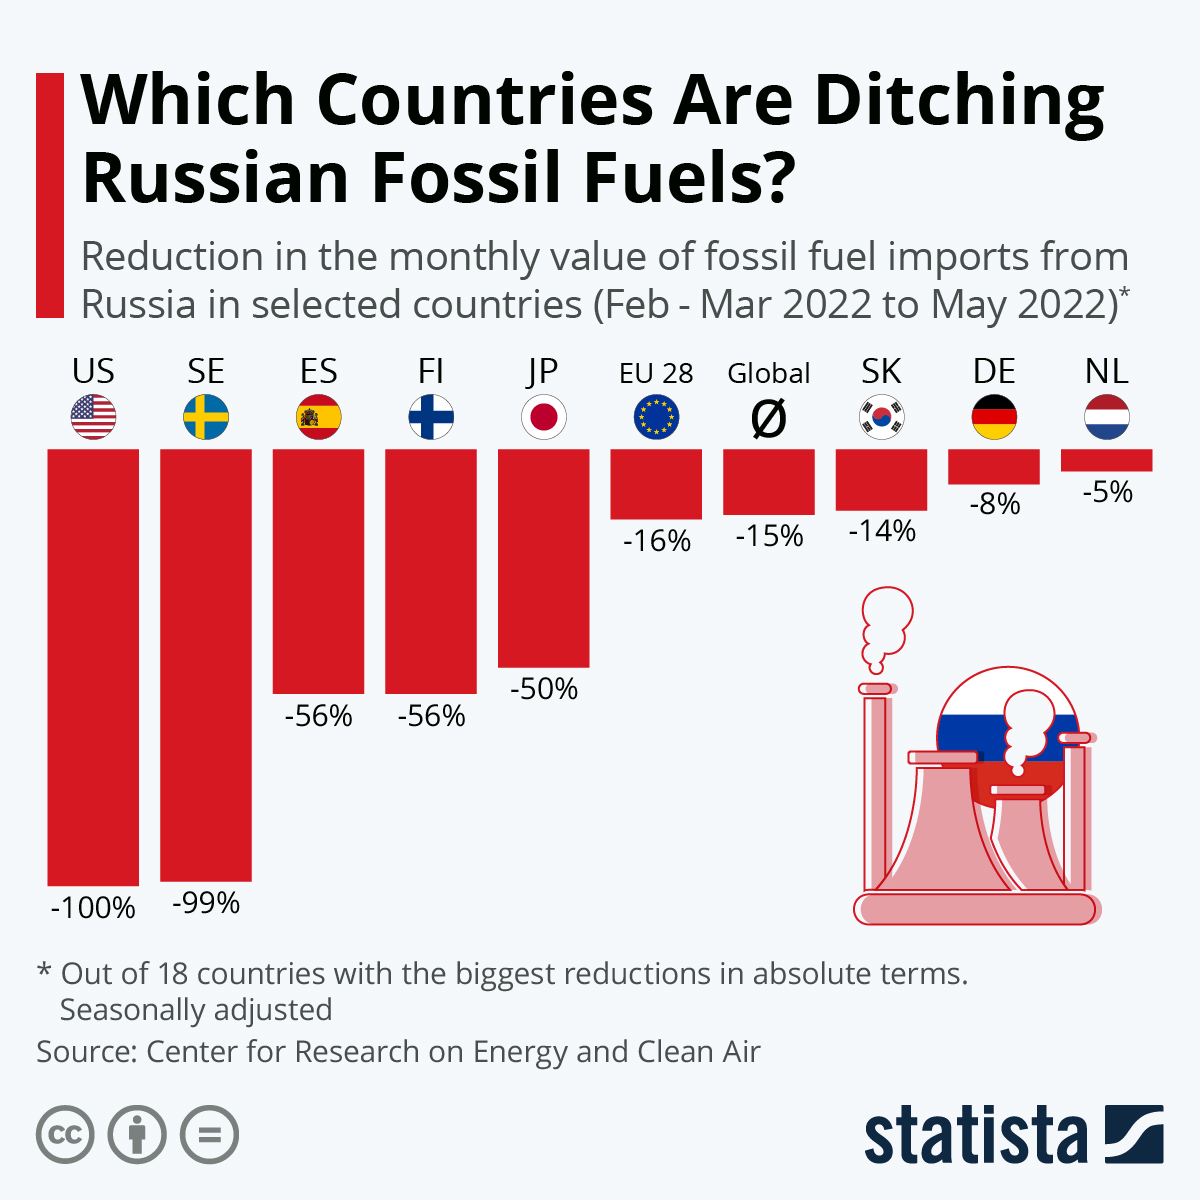
Data from the Center for Research on Energy and Clean Air shows that European Union cutbacks on Russian fossil fuel imports lingered around the world average of a 15 percent reduction in monetary terms as of May. For this metric, rising world market prices run counter to reductions in the volume of imports – showing the extreme difficulty in trying to cut Russia off from one of its main revenue sources.
Spain, Finland as well as Lithuania, Poland and Estonia, and – most of all – Sweden has nevertheless managed to cut back their Russian fossil fuel imports completely or at least significantly. Germany, the Netherlands, and Italy remained below the global average.
Because of the different country sizes and different levels of dependence on Russia, these relative reductions do not all have the same weight in absolute terms. According to the report, the United States managed the biggest absolute reduction by cutting out Russian fossil fuels completely and reducing daily revenues for Russia by around $33 million between February-March and May 2022. However, the combined 16-percent reduction by European Union countries – despite being smaller in relative terms – cut a much larger $114 million from daily Russian revenues over the same time period.
One country supplying more money to Russia by buying up discounted fuel shipments is India. Between February-March and May, the country spent approximately $65 million more per day on Russian energy. All in all, Russia has been losing fossil fuel revenues of around $100 million per day since the start of the invasion. Despite the discounts on shipments and the loss of customers, Russia is still earning almost 40 percent more on its energy exports when compared to May 2021 as world market prices are through the roof.
You will find more infographics at Statista
Ask me anything
Explore related questions


