While the U.S. already banned imports of Russian energy in March and April shortly after the country’s invasion of Ukraine, the EU as one of Russia’s crucial trading partners is taking longer to ween itself off Russian gas, oil and coal. Import data on both the EU and the U.S. shows how big the difference in their energy dependence on Russia is.
While 2021 mineral fuel imports into the U.S. from Russia were the equivalent of $50 million spent on Russian energy per day, that number was $296 million in the EU. This is according to numbers by the European Commission, the UN Comtrade database and the U.S. Census Bureau.
An EU ban on imports of coal – the most ubiquitous and easiest to replace commodity – is expected to go into full effect in August. Only on Friday, major opponent Germany gave the green light for an EU ban on the import of Russian oil. The ban is expected be in effect by the end of the year in case the bloc can agree on the deal.
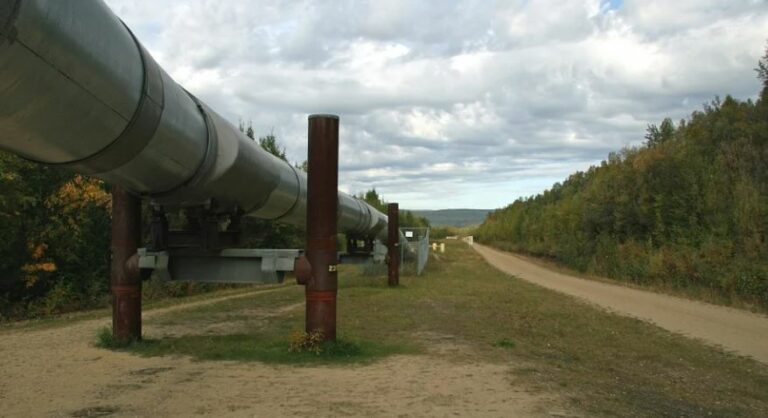
Finally, Russian gas is the hardest to replace fossil fuel for the EU as it arrives on the continent via pipelines and many countries are still missing the infrastructure to receive LNG. In addition, dependence on Russia is the most ingrained in Europe, with several countries sourcing large chunks of their gas supply from their Eastern neighbor.
Russia exports mainly raw materials and mineral fuels make up the absolute majority of the goods imported to the EU and the U.S. from the country in 2021. Iron, steel and wood as well as precious stones and metals made up smaller parts of imports from Russia to the countries. All products imported from Russia only amounted to 0.7 percent of the U.S. trade in goods in 2021, while this number was a more significant 3.6 percent in the EU.

You will find more infographics at Statista
Ask me anything
Explore related questions