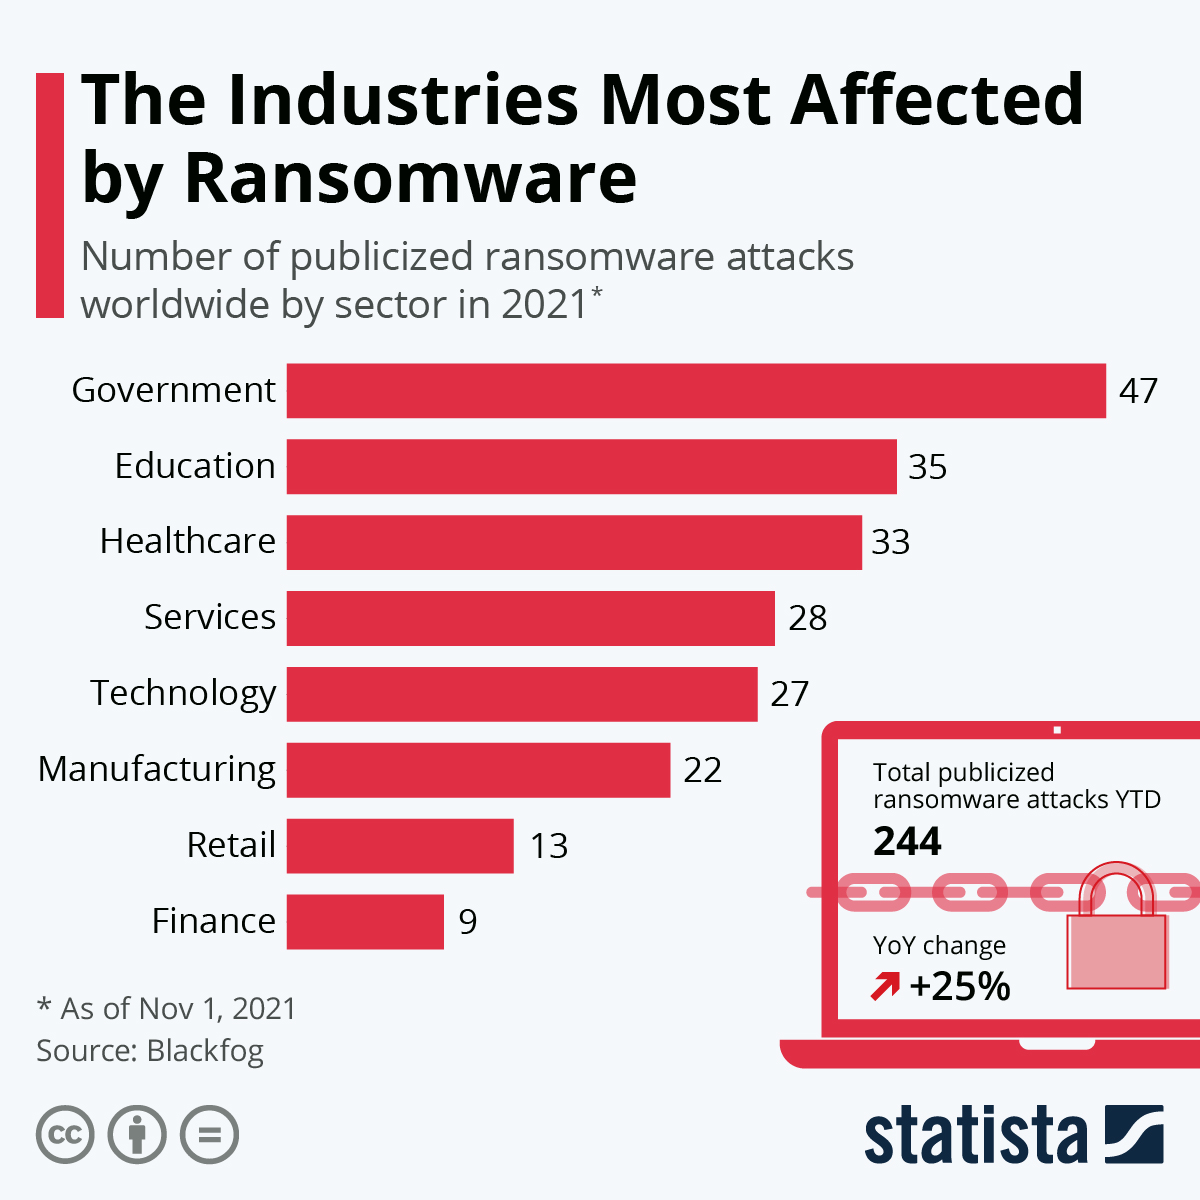
Yaroslav Vasinskyi, a member of now-defunct hacker group REvil and alleged orchestrator behind the ransomware attack against U.S. tech company Kaseya, has been charged by the Department of Justice after his arrest in Poland last month. The hack, which targeted approximately 1,500 businesses and resulted in ransom demands totaling $70 million according to TechCrunch, is only one of several hundred publicized ransomware attacks in 2021 as our chart indicates.
Data from security firm Blackfog shows that from January to November of this year, 244 ransomware hacks were publicized, an increase of 25 percent compared to the same period in 2020. While this number may seem low at first glance, Blackfog’s data is focused on initial targets made public by hacking groups and the victims coming forward themselves. The number of systems affected in what were mostly so-called supply chain attacks are not listed in the site’s reporting. Those kinds of breaches have become the norm and can affect thousands of businesses via one access point, as was the case with the Kaseya hack. Even though the breach at the tech company was one of the more higher-profile cases, the majority of the publicized cyber attacks with ransom demands hit different sectors like healthcare, education or services. Most of those hacks occurred in the government sector with 47 publicly addressed instances. Among the victims were the cities of Angers in France, Liege in Belgium and Tulsa, Oklahoma, as well as government bodies in the UK, Germany, Italy and India.
also read
Winter is coming…Significant drop in temperature forecast across Greece
Charming destinations in Greece: Medieval castles strange Dragon houses
When it comes to malware, ransomware is one of the fastest-growing threats in recent history, with experts estimating that one attack will take place every 11 seconds in 2021. According to antivirus software provider Emsisoft, the liberal estimate for costs connected to ransomware hacks stood at $7.5 billion for 2019 alone.
source statista
You will find more infographics at Statista
Ask me anything
Explore related questions


