
The U.S. National Science Foundation (NSF) has released data showing that 2,555,959 science and engineering (S&E) articles were published around the world in 2018, a considerable increase on the 1,755,850 recorded a decade ago. Global research output in that sector has grown around 4 percent annually over the past ten years and China’s growth rate is notable as being twice the world average. While the U.S. led the way in 2008, it has now been displaced as the world’s top S&E research publisher by China.
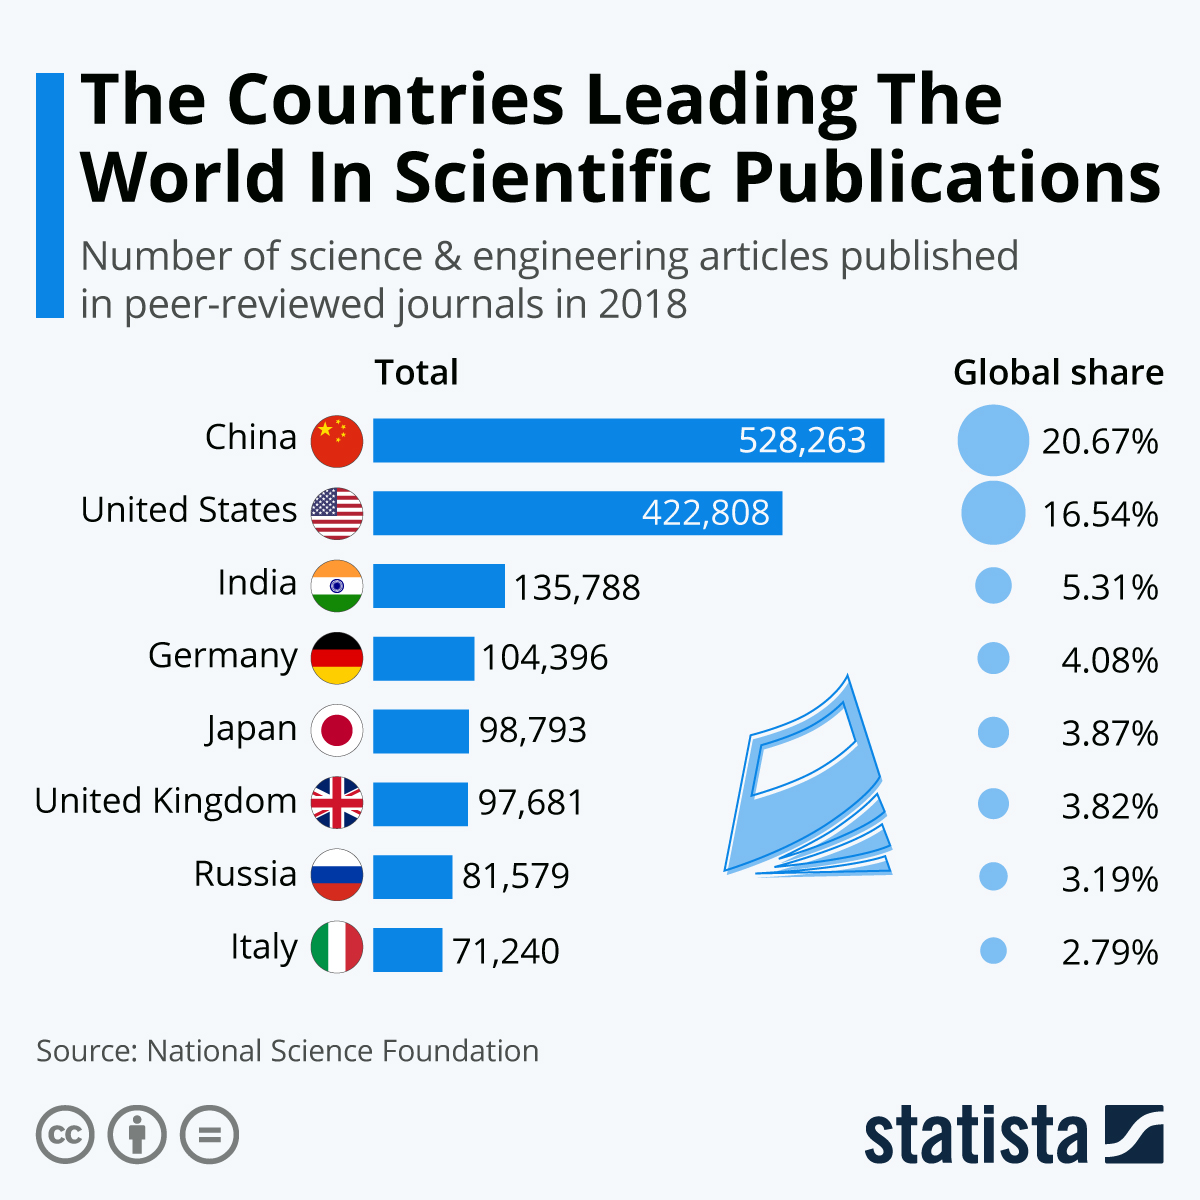
In 2008, the U.S. published 394,979 S&E articles in peer-reviewed journals, ahead of China’s 249,049. China’s rapid growth rate saw it publish 528,263 articles last year, ahead of U.S. output totalling 422,808. India came third in 2018 with 135,788. The European Union’s collective output came to 622,000 research articles, meaning it accounted for almost a quarter of the global total. China made up 20.67 percent while the U.S. accounted for 16.54 percent.
source statista
You will find more infographics at Statista