
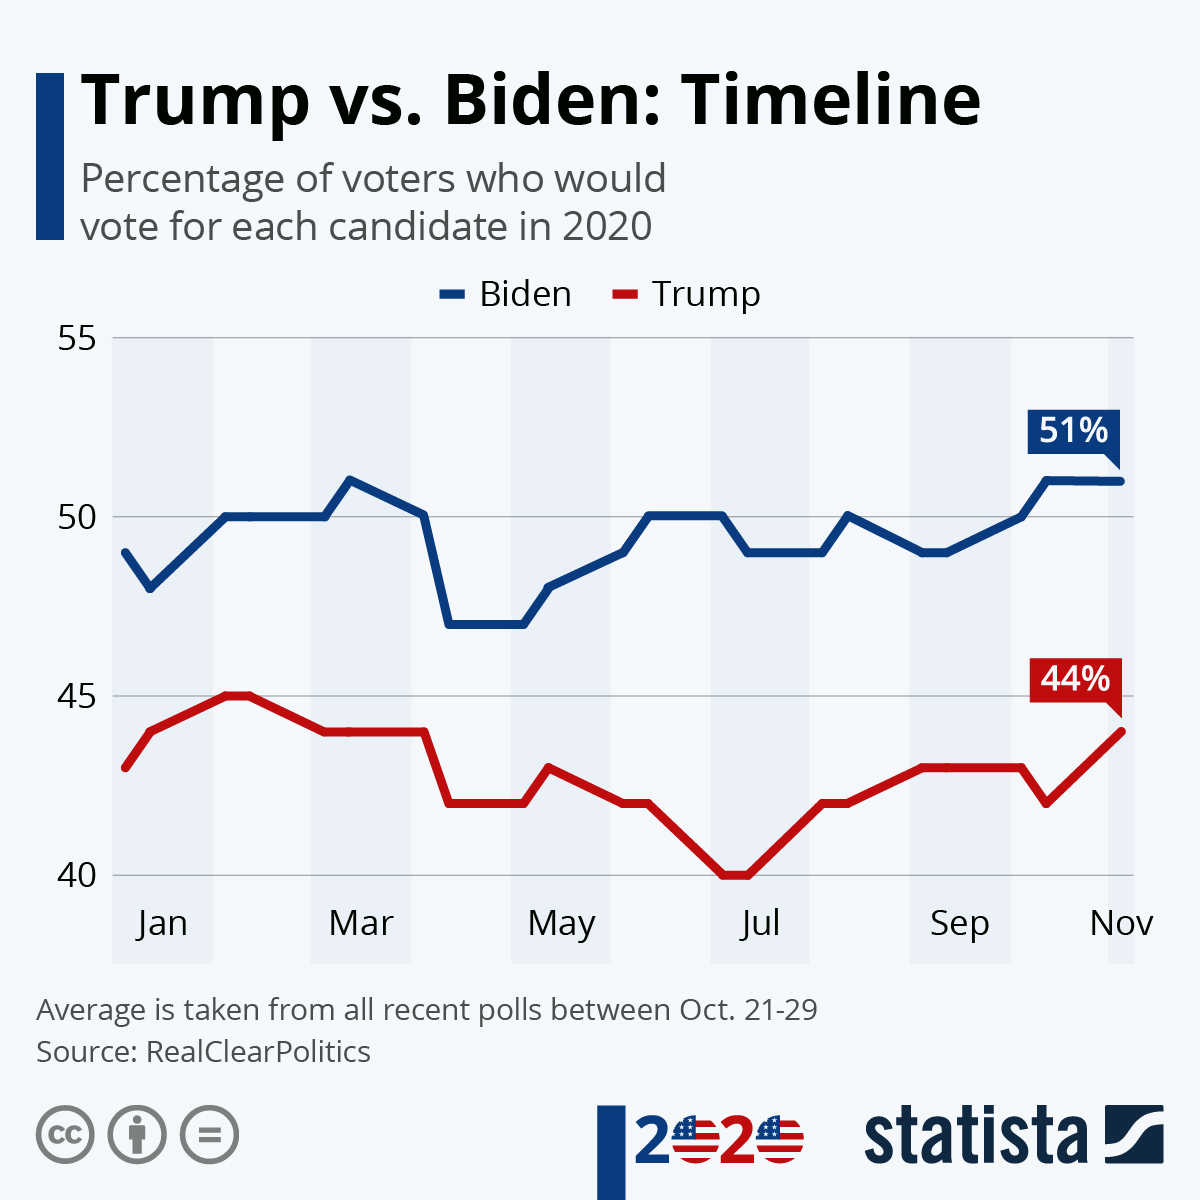
A timeline of the average voter favourability toward Democratic presidential nominee Joe Biden and incumbent Donald Trump shows how, head-to-head, Biden has held a significant lead over Trump for all of 2020.
also read
Are you drinking too much? This test will reveal if you’ve got an alcohol problem
Over the last couple of months, Biden has enjoyed one of his largest favourability leads over Trump, averaging around 7-10 percentage points higher than the current president. Even when Biden wasn’t the favorite to win the Democratic nomination in January and February, he still held a sizable lead over Trump.
As of Sept. 15, Biden’s average lead over Trump had shrunk to around 6 percentage points. While that’s still a large gap, it is starting to trend in Trump’s favour as the country approaches the general election in November. The pandemic, protests and economic crisis in the U.S. have certainly taken their toll on the incumbent’s approval, however Trump has certainly had enough time to swing voter favourability ever-so-slightly back in his favor. The campaign is also hoping the Republican National Convention that ended on Aug. 27 serves to further bring Trump’s favourability higher.
source statista
You will find more infographics at Statista
Ask me anything
Explore related questions