
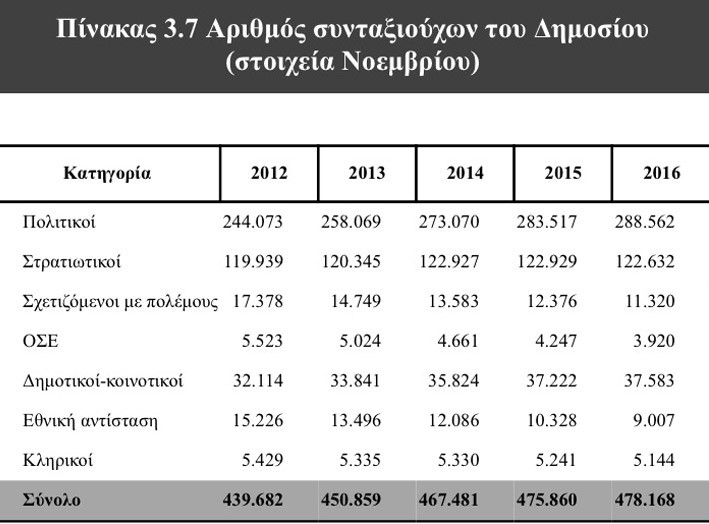
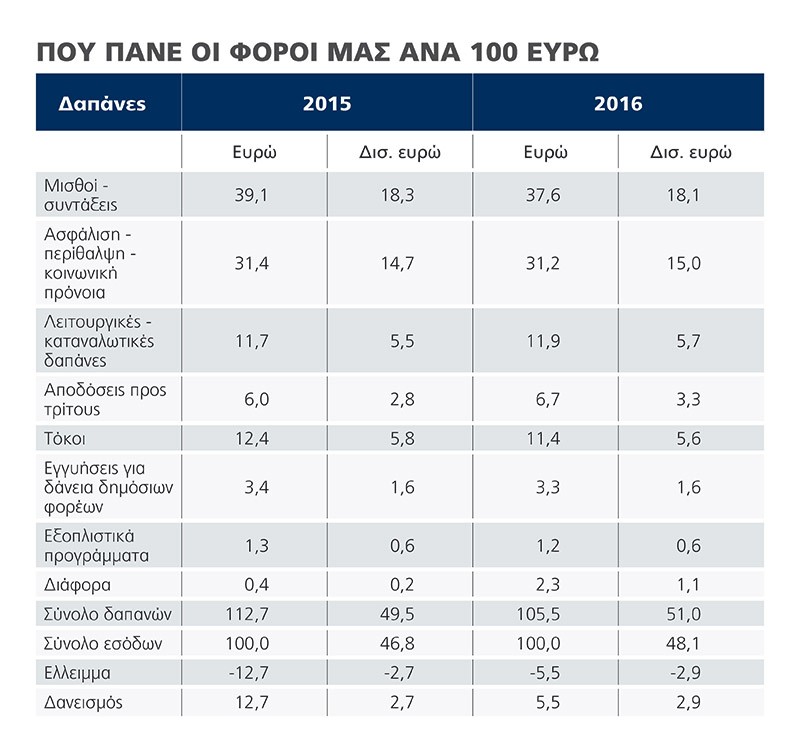
The average Greek wage earner pays 60% of their salary to taxes and other forms of contributions to the state, according to official data, which is 20 percentage points above the German average and 70% over the OECD average! Nearly 70% of Greeks says they are unable to cover their financial responsibilities, while 3 out of 4 fail to pay their monthly bills. The new budget submitted recently in parliament is only expected to exacerbate this incapacity of Greek taxpayers to cover their arrears. Another question that arises is where exactly do all these taxes go. The following tables reveal where this money is funnelled to per 100 euros and how the state is forced to take out loans in order to cover its deficits. 40% of the taxes per 100 euros are directed to covering public servant salaries and pensions, while over 30% goes to welfare and social security costs. It should be noted that the number of public sector pensioners in Greece has increased to 478,168 from 439,682 since 2012, while a substantial number of those are categorised as “politicians”…Amid a period of harsh economic austerity the average Greek is burdened with paying out 12 euros per 100 out of his income to cover overhead and consumption costs of the public sector, while an additional 12 plus euros goes towards covering state guarantees to cover deficit running state operations and organisations. Another noteworthy, and disheartening, point is the fact that the aggregate direct and indirect taxes of 2016 dropped, despite the increase in tax coefficients. It is estimated that the total tax revenues will amount to 45.8 billion euros in 2016, compared to 49.7 billion in 2009 at the onset of the economic crisis. According to the OECD data in 2011, the tax efficiency of the VAT has been limited to 0.44 compared to the organisation’s 0.71 average.
Ask me anything
Explore related questions