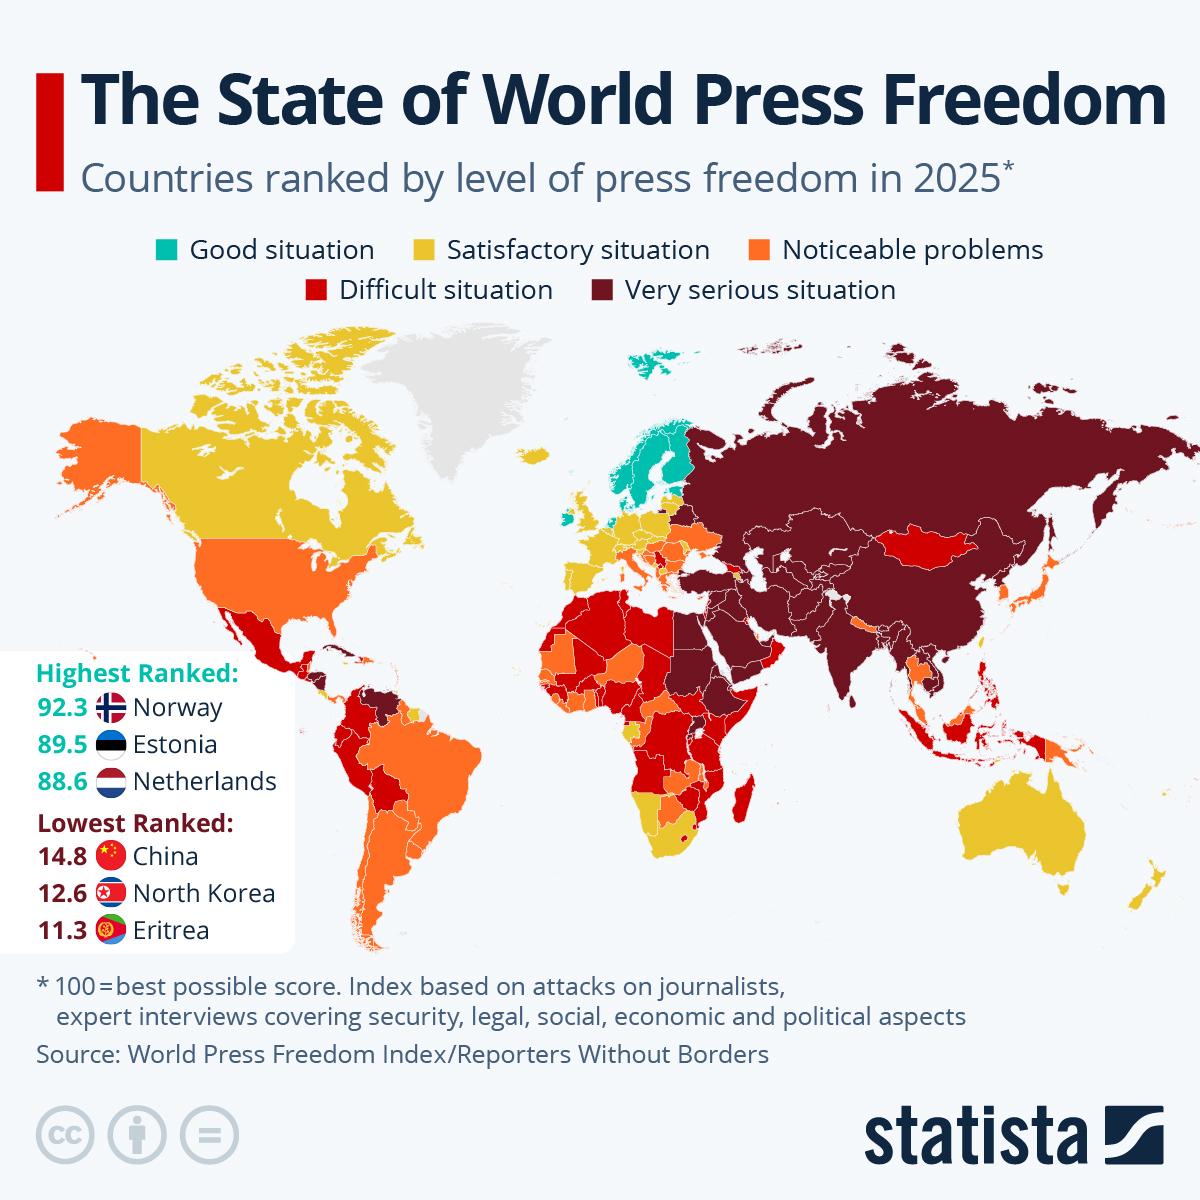
The 2020 World Press Freedom Index, compiled by Reporters Without Borders, was released this week. It states that the next 10 years are going to prove pivotal for press freedom due to five converging factors – geopolitical crisis (driven by aggression from authoritarian regimes), a technological crisis (due to a lack of democratic guarantees), a democratic crisis (due to polarization and repression), a trust crisis (suspicion and hatred of the press) and an economic crisis (impoverishing quality journalism). These are all going to be compunded by the coronavirus pandemic.
The research states that the response to the pandemic has illustrated a clear correlation between levels of media suppression in some countries and their position on the index. Iran and China are key examples who suppressed coverage during their outbreaks and they rank 173rd and 177th respectively. The past two editions of the Global Press Freedom Index called attention to a crisis emerging in some democracies where flagrant attacks on the media and open hostility towards journalists are resulting in more frequent and serious acts of violence that are creating an unprecedented state of fear.
President Trump has displayed repeated and open hostility towards journalists throughout the pandemic and the U.S. only manages 45th position in the index. Brazil is languishing in 107th and its leader, Jair Bolsonaro, has also stepped up steep criticism of his country’s media with his cabinet even orchestrating large scale online attacks on journalists. North Korea is rock bottom of the index, followed by Turkmenistan and Eritrea.
Northern Europe has the highest levels of media freedom worldwide and Norway was ranked first. It is followed by Finland and Denmark in the top-three while the top-five is rounded off by Sweden and the Netherlands. The Reporters Without Borders have compiled the index annually since 2002 and levels of press freedom are calculated through a range of indicators such as media independence, transparency and the media environment in general.
source statista

You will find more infographics at Statista
Ask me anything
Explore related questions


