
From September 15 to September 18, Tokyo Game Show will again open its doors at Makuhari Messe in Chiba City after two online editions in 2020 and 2021 due to the effects of the coronavirus pandemic. The video game trade fair is one of the largest in the world, drawing 262,000 visitors in 2019. The event mainly focuses on Japanese titles and publishers like Capcom, Nintendo, Bandai Namco and Konami, but a handful of international exhibitors have also decided to take the trip. This focus on homegrown games is not surprising. As our chart shows, the share of gamers in Japan’s population ranks among the highest in the world and will likely continue to do so in the future.
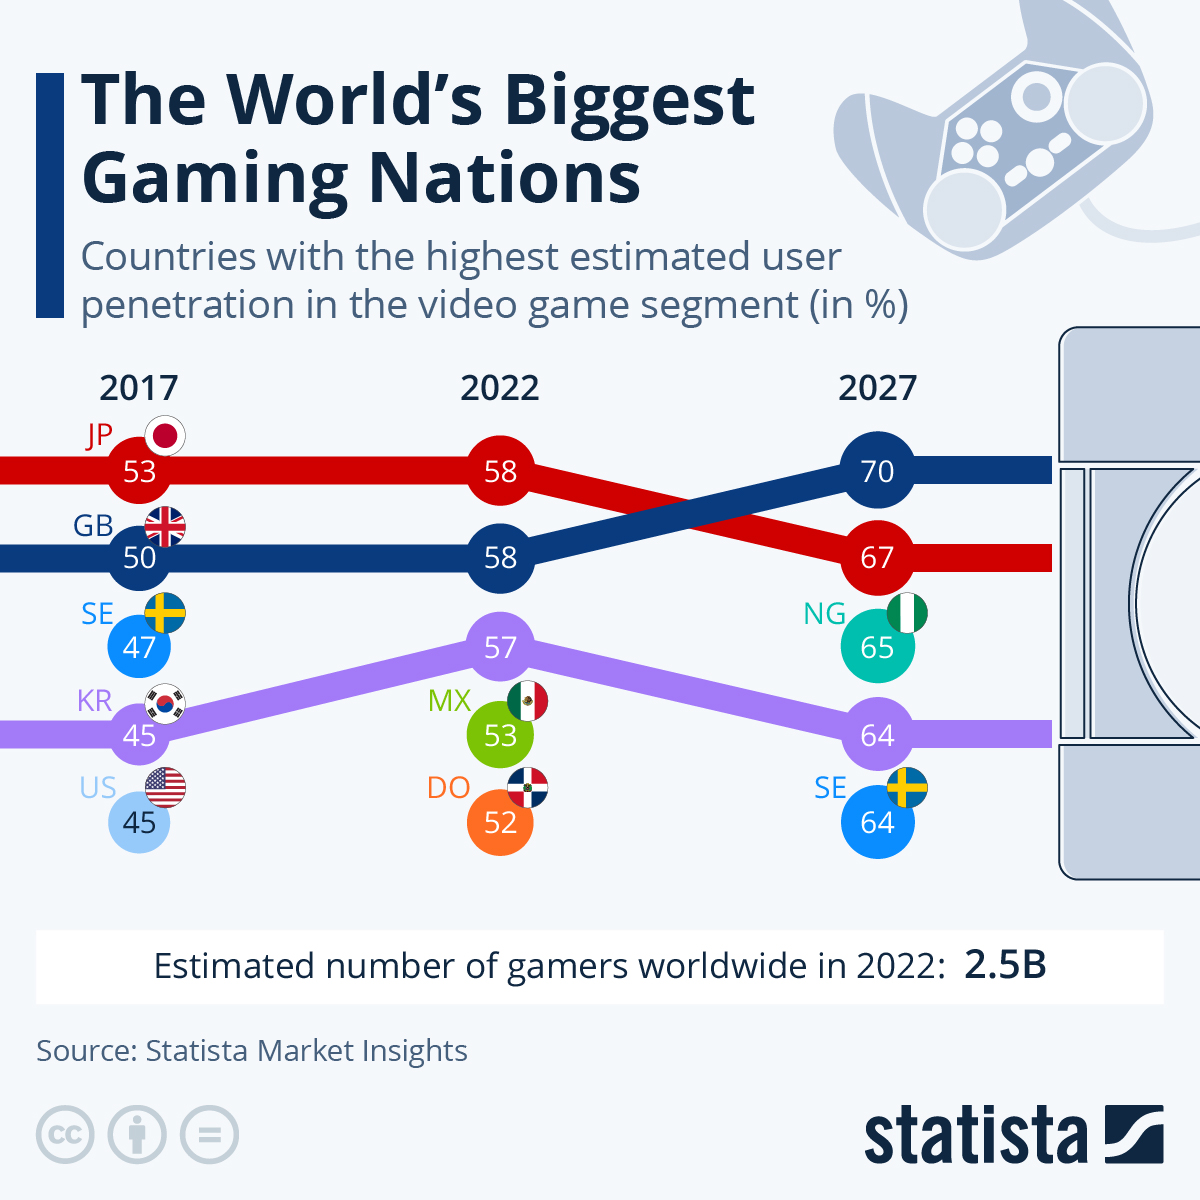
According to estimates from our Statista Digital Market Outlook, Japan has consistently placed first or second in terms of the percentage of the population being considered gamers. A penetration rate of 53 percent in 2017 and 58 percent in 2022 earned Japan the top spot in both years. South Korea, home to many elite e-sports players and organizations, also snags a top 5 spot and even comes in third in 2022.
In the future, the United Kingdom will most likely overtake Japan in terms of user penetration. By 2027, 70 percent of UK residents are expected to qualify as gamers, reflecting the importance of the market. In a Newzoo ranking, the country places sixth with estimated revenue of $5.7 billion in 2022.
Overall, video games have become the most lucrative media segment concerning revenue over the last few years. 2022 will see the market grow to over $196 billion, according to Newzoo estimates, with $104 billion generated with mobile gaming alone. In comparison, revenues from the music and film industries reached $25.9 billion and $21.3 billion in 2021, while video streaming providers like Netflix and Disney+ generated an estimated $62 billion in 2020.
You will find more infographics at Statista
Ask me anything
Explore related questions