
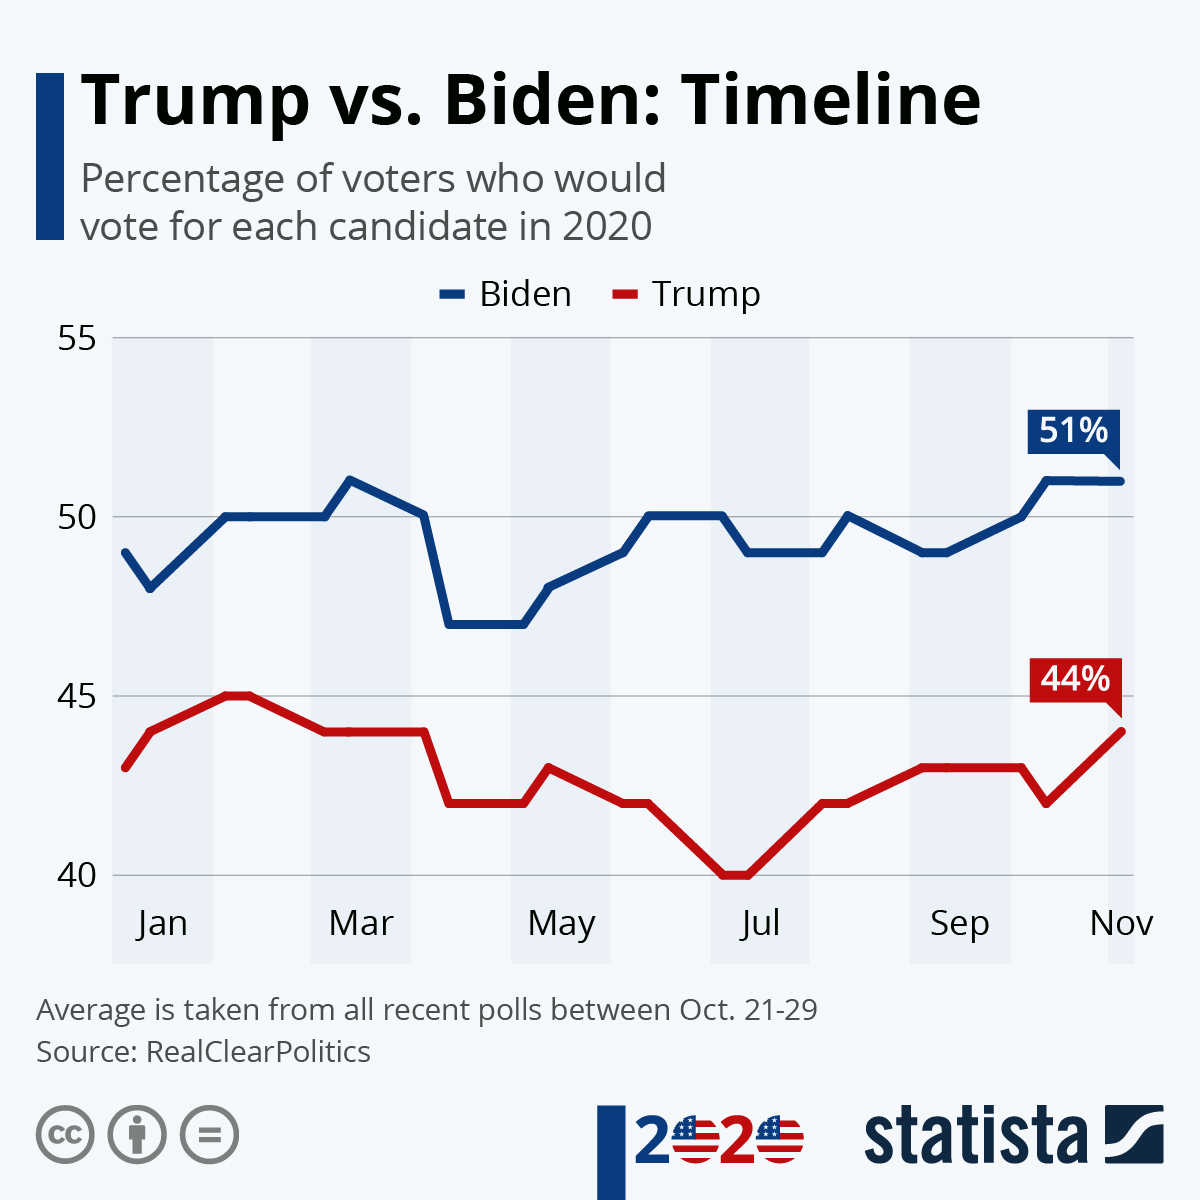
A timeline of the average voter favorability toward Democratic presidential nominee Joe Biden and incumbent Donald Trump shows how, head-to-head, Biden has held a significant lead over Trump for all of 2020.
Over the last couple of months, Biden has enjoyed one of his largest favorability leads over Trump, averaging around 7-10 percentage points higher than the current president. Even when Biden wasn’t the favorite to win the Democratic nomination in January and February, he still held a sizable lead over Trump.
also read
Covid-19 Greece – 1,678 cases on Sunday
Armenian genocide memorial in France vandalised by pro-Turkish inscriptions (photo)
As of Nov. 1, Biden’s average lead over Trump had steadied to around 7 percentage points. With just two days to go before the election, that’s one of the largest polling leads from a challenger in history. Other historic factors, like the country’s record 80+ million early and absentee ballots already cast, seem to favor a Biden victory over Trump come Nov. 3. Still, one of the big deciding factors for Biden will be whether remaining Democrats flock to the polls in as large of numbers as Republicans on election day. If voting blocs in swing states like Florida, Texas and Pennsylvania favor Trump, there are still statistical chances for the current president to capture enough Electoral College votes to retain his job.
source statista
You will find more infographics at Statista
Ask me anything
Explore related questions